Monday, October 15, 2012

Coming Trading Week Full of Action & Volatility.!!!.

Nifty:->>
 
At this point in time Market is looking rock solid on buying spree by FII.It looks like that Market will make new high before this Diwali but it does not mean at all that it will go straight and only in single direction.As per my view it will take a breather and it might go down 200 points from current levels, as it looks exhausted at this level and secondly some major companies are going to declare their quarterly results in coming week so Market will take some sure direction on first day of week itself as Reliance will announce its quarterly result and on Friday it will be TCS declaring its quarterly result.So next week will be full of Action and Volatility.On buying side it will be Idea,Videoind,Wyeth while on selling side it will be Infy and Heromotoco.
 

Nifty Weekly Levels:->
 
 Buy Above 5688 Target  5740,5803,5855 and Sell Below 5688 Target 5624,5573,5510.
 
Stocks:->>
 
BUY VIDEOIND @172 SL 168 TRGT 181-200.
 
BUY WYETH @890-95 SL 880 TRGT 920-50.
 
For More Details Kindly Refer Following Charts........!!!


NOTE:-PLEASE FOLLOW STRICT STOP LOSS & BOOK PROFIT WHENEVER YOU FEEL LIKE.HAPPY & SAFE TRADING.ENJOY.

Sunday, September 9, 2012

Stock Market Trading For Coming Week.!!!


Stock Market rejoiced all over the world on back of bond-buying plan of ECB last week.Nifty also opened with gap up and closed with huge gain, but Stock markets are likely to witness volatile trading in the coming week in view of industrial output and inflation data that are lined up for release, July's industrial output data will be released on September 12, and August headline inflation figure on September 14 and it ll be key triggers for our Market and it will provide key inputs for a decision on interest rates coming ahead of RBI's monetary policy review on September 17.The Indian markets will continue to take positive cues from global events in spite of the weak domestic economic and political environment.But It will not be easy to hold on to the gains amid growing concerns about the economy and the government's ability to push through key reforms.
IF Nifty sustains above 5350 likely upside target shall be 5400-5450. On the other hand, if it goes below the 5300 level, further selling pressure is likely up to 5280-5250.


 Jain Irrigation looks oversold on chart we can buy it with stop-loss of 50 and target of 80.


 NOTE:-PLEASE FOLLOW STRICT STOP LOSS & BOOK PROFIT WHENEVER YOU FEEL LIKE.HAPPY & SAFE TRADING.ENJOY.

Monday, August 20, 2012

Breakout Expectations With Some Failed Attempts.!!!

As i mentioned in previous post that negative divergence is reflecting on Nifty chart, notwithstanding Nifty attempted to cross 5400 but could not cross. Nifty looking tired or waiting for some positive trigger if it does not happen then its bound to come down. Level 5400 playing as major resistance or breakout point if it cross it convincingly then 5600 is most likely on chart, while on downside 5300 acting as crucial support if broken then more downside ll happen. my personal view ll be to short Nifty at current levels.(See chart below).
 
In Next chart i posted my analysis on VIDEOIND, its most likely that it ll give breakout above 177 level,In past as well it attempted few times to cross and close above 177 but failed.However as per chart if you see indicators like MACD has given positive cross-over and growing VOLUME,rising RSI indicate & strengthen the probablity of a positive breakout.Buy it above 175  maintain stop loss of  170  on closing basis first target ll be 183 and second target ll be 188.Kindly trade as per chart.


NOTE:-PLEASE FOLLOW STRICT STOP LOSS & BOOK PROFIT WHENEVER YOU FEEL LIKE.HAPPY & SAFE TRADING.ENJOY.

Sunday, August 12, 2012

To Bharti and Nifty.....With Love.!!!

Bharti Airtel posted not so good result this time that resulted in free fall of the stock.it fell around 13% in quick succession.However its a leading telecom provider and it cant bite the dust so easily.it has become oversold and showing positive divergence on its chart,we should initiate buy on  it but we should buy it on dips and in small quantities keeping a stop loss of 238 on closing basis with a target of  270-80 in short term.(refer below chart).


Nifty looking exhausted on chart and showing negative divergence if it does not cross convincingly 5400 then its bound to come down to 5100.we can trade nifty on selling it.

NOTE:-PLEASE FOLLOW STRICT STOP LOSS & BOOK PROFIT WHENEVER YOU FEEL LIKE.HAPPY & SAFE TRADING.ENJOY.

Sunday, August 5, 2012

Market For Coming Week....Stock and Nifty.!!!

Nifty chart this time does not provide any clear direction about market movement even on chart one indicator shows some upside move may happen while other reflect negative.As FII buying & DII selling      so we can expect  some range-bound  movement until we get some concrete trigger.

In other chart attached here Welcorp is very much oversold & resting on support levels,i believe  if it holds
current levels then it can go 10-20% higher from here,so we can initiate buy on it with strict stop-loss. 


NOTE:-PLEASE FOLLOW STRICT STOP LOSS & BOOK PROFIT WHENEVER YOU FEEL LIKE.HAPPY & SAFE TRADING.ENJOY.

Sunday, July 15, 2012

Nifty and Stock Trading for Coming Week.!!!


Technical indicators on Nifty chart suggest some downside move,it might not be because of weakness in market but of its move to complete the pattern.However as the result season has started so market would be a bit more volatile that would trigger stop loss both side,a cautious approach would help us to avoid losses.Kindly trade Nifty as per below chart first immidiate support is 5180 on closing basis next major support would be 5000.
 
In next chart WIPRO is looking heavily oversold and closed on it support 360 where from a small pullback is expected.we can trade it on intra and delivery basis,however we need to keep strict stoploss.Buy it around 355-60 sl 340 trgt 390 in two months time frame or we can also trade it on selling side, sell below 360 sl 360 on closing basis target 340.


Sunday, July 8, 2012

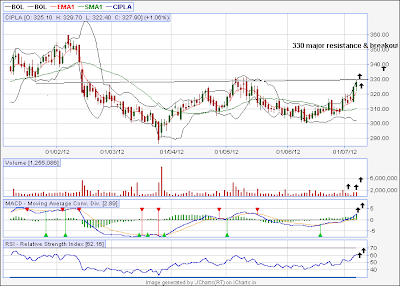
Technical View on Cipla.!!!

Hi Friends,Cipla has come on such a point @330 where from it can go either ways i.e. We can trade it both ways as per below chart buy above 330 sl 320 trgt 340-350 or sell below 330 sl 340 trgt 320-310. Kindly follow strict stop loss and book profit where ever you feel.Happy & Safe Trading.ENJOY.


CIPLA is ready to give upside breakout.it just need support of good volume & conducive market condition,However it can be traded both sides but turning point closing above or below 330.Buy above 330 sl 320 trgt 340-50 or sell below 330 sl 340 trgt 320-10.

Monday, July 2, 2012

Between Support.....and........Resistance.!!!

Few Indicators on nifty charts indicate that some more steam is left and that can lead nifty towards a gap up opening on monday where it ll be among many hurdles. To cross these hurdles would not be an easy task major hurdle ll be 5400 levels, crossing this convincingly 5600 would be next target.But i would like to short nifty positionally after gap up opening or any upmove during the day with sl of 5400.
 
BUY BHARTI ARTL 300-305 SL 295 TRGT 320.
 
BUY IDEA 74-75 SL 73 TRGT 80.
 
ACCUMULATE RUCHISOYA ON DIPS SL78 TRGT 110.
 
NOTE:-Kindly book profit whenever you feel like & maintain strict stop loss.Happy & Safe Trading.ENJOY.

Wednesday, June 6, 2012

Hi,Friends.....!!!

Hi My dear Friends,i am back from a very long break from stock market as i was very busy in some family matters but now onwards i am available to all of you to discuss on stock market.However i missed my all friends during this period.Now come to stock market.

BUY ON EVERY DIP BHARTIARTL AROUND 280-85 SL 260 TRGT 320-50.

BUY OPTOCIRCUITS AROUND 150 SL 139 TRGT 175-80.

NOTE:-KEEP STRICT STOPLOSS & BOOK PROFIT WHENEVER YOU FEEL LIKE.


                                ""ENJOY, HAPPY  &  SAFE TRADING""